Chapter 9 Appendix
The appendix collects mathematical and statistical results used throughout the book. It is designed for reference: individual sections can be consulted when a definition, proof, distribution, or table is needed.
Prerequisites. The notation introduced in the chapter that refers to the relevant appendix result.
After consulting the relevant sections, you should be able to:
- Use principal components to summarize high-dimensional variation.
- Apply the matrix identities required in regression and likelihood calculations.
- Recall standard distributions, stochastic convergence results, and Gaussian conditioning formulas.
- Locate longer proofs and statistical quantiles without interrupting the main exposition.
Roadmap. The appendix moves from principal components and linear algebra to statistical definitions and distributions, stochastic convergence, Gaussian results, selected proofs, and statistical tables.
9.1 Principal component analysis (PCA)
Principal component analysis (PCA) reduces the dimension of a dataset when much of its variation can be summarized by a small number of linear combinations. The method is widely used in economic data analysis, visualization, and image compression.
Suppose that we observe \(T\) realizations \(x_1,\ldots,x_T\) of an \(n\)-dimensional random vector \(x\), and that each component has been centered to have mean zero.
Let \(X=[x_1,\ldots,x_T]'\) denote the resulting \(T\times n\) data matrix, and denote its \(j^{th}\) column by \(X_j\).
We seek a unit-length vector \(u\) such that the linear combination \(Xu\) has maximum sample variance. Thus, we solve \[\begin{equation} \begin{array}{clll} \underset{u}{\arg\max} & u'X'Xu. \\ \mbox{s.t. } & \left\Vert u \right\Vert =1 \end{array}\tag{9.1} \end{equation}\]
Since \(X'X\) is symmetric and positive semidefinite, it admits the following decomposition: \[\begin{eqnarray*} X'X & = & PDP'\\ & = & P\left[\begin{array}{ccc} \lambda_{1}\\ & \ddots\\ & & \lambda_{n} \end{array}\right]P', \end{eqnarray*}\] where \(P\) is an orthogonal matrix whose columns are the eigenvectors of \(X'X\).
We can order the eigenvalues such that \(\lambda_{1}\geq\ldots\geq\lambda_{n}\geq0\). Some eigenvalues are zero when \(X\) does not have full column rank.
Since \(P\) is orthogonal, we have \(u'X'Xu=u'PDP'u=y'Dy\) where \(\left\Vert y\right\Vert =1\). Therefore, we have \(y_{i}^{2}\leq 1\) for any \(i\leq n\).
As a consequence: \[ y'Dy=\sum_{i=1}^{n}y_{i}^{2}\lambda_{i}\leq\lambda_{1}\sum_{i=1}^{n}y_{i}^{2}=\lambda_{1}. \]
It is easily seen that the maximum is reached for \(y=\left[1,0,\cdots,0\right]'\). Therefore, the maximum of the optimization program (Eq. (9.1)) is obtained for \(u=P\left[1,0,\cdots,0\right]'\). That is, \(u\) is the eigenvector of \(X'X\) that is associated with its larger eigenvalue (first column of \(P\)).
Let us denote with \(F\) the vector that is given by the matrix product \(XP\). The columns of \(F\), denoted by \(F_{j}\), are called factors. We have: \[ F'F=P'X'XP=D. \] Therefore, in particular, the \(F_{j}\)’s are orthogonal.
Since \(X=FP'\), the \(X_{j}\)’s are linear combinations of the factors. Let us then denote with \(\hat{X}_{i,j}\) the part of \(X_{i}\) that is explained by factor \(F_{j}\), we have: \[\begin{eqnarray*} \hat{X}_{i,j} & = & p_{ij}F_{j}\\ X_{i} & = & \sum_{j}\hat{X}_{i,j}=\sum_{j}p_{ij}F_{j}. \end{eqnarray*}\]
Consider the share of variance that is explained—through the \(n\) variables (\(X_{1},\ldots,X_{n}\))—by the first factor \(F_{1}\): \[\begin{eqnarray*} \frac{\sum_{i}\hat{X}'_{i,1}\hat{X}_{i,1}}{\sum_{i}X_{i}'X_{i}} & = & \frac{\sum_{i}p_{i1}F'_{1}F_{1}p_{i1}}{tr(X'X)} = \frac{\sum_{i}p_{i1}^{2}\lambda_{1}}{tr(X'X)} = \frac{\lambda_{1}}{\sum_{i}\lambda_{i}}. \end{eqnarray*}\]
Intuitively, if the first eigenvalue is large, it means that the first factor captures a large share of the fluctutaions of the \(n\) \(X_{i}\)’s.
By the same token, it is easily seen that the fraction of the variance of the \(n\) variables that is explained by factor \(j\) is given by: \[\begin{eqnarray*} \frac{\sum_{i}\hat{X}'_{i,j}\hat{X}_{i,j}}{\sum_{i}X_{i}'X_{i}} & = & \frac{\lambda_{j}}{\sum_{i}\lambda_{i}}. \end{eqnarray*}\]
The term structure of interest rates provides a standard application. Yields at different maturities move together and can often be summarized by a few factors (see Litterman and Scheinkman 1991). We apply PCA to data from the FRED database (series DGS6MO, DGS1, and related maturities). The estimated loadings can be interpreted as level, slope, and curvature factors.
To run a PCA, one simply has to apply function prcomp to a matrix of data:
Code
Figure 9.1 summarizes the results. The upper-left panel reports the share of total variance explained by each principal component, and the upper-right panel displays the factor loadings. The lower panels compare observed yields with reconstructions based on only the first two components.
Code
par(mfrow=c(2,2))
par(plt=c(.1,.95,.2,.8))
barplot(PCA.yds$sdev^2/sum(PCA.yds$sdev^2),
        main="Share of variance expl. by PC's")
axis(1, at=1:dim(yds)[2], labels=colnames(PCA.yds$x))
nb.PC <- 2
plot(-PCA.yds$rotation[,1],type="l",lwd=2,ylim=c(-1,1),
     main="Factor loadings (1st 3 PCs)",xaxt="n",xlab="")
axis(1, at=1:dim(yds)[2], labels=colnames(yds))
lines(PCA.yds$rotation[,2],type="l",lwd=2,col="blue")
lines(PCA.yds$rotation[,3],type="l",lwd=2,col="red")
Y1.hat <- PCA.yds$x[,1:nb.PC] %*% PCA.yds$rotation["Y1",1:2]
Y1.hat <- mean(USyields$Y1) + sd(USyields$Y1) * Y1.hat
plot(USyields$date,USyields$Y1,type="l",lwd=2,
     main="Fit of 1-year yields (2 PCs)",
     ylab="Obs (black) / Fitted by 2PCs (dashed blue)")
lines(USyields$date,Y1.hat,col="blue",lty=2,lwd=2)
Y10.hat <- PCA.yds$x[,1:nb.PC] %*% PCA.yds$rotation["Y10",1:2]
Y10.hat <- mean(USyields$Y10) + sd(USyields$Y10) * Y10.hat
plot(USyields$date,USyields$Y10,type="l",lwd=2,
     main="Fit of 10-year yields (2 PCs)",
     ylab="Obs (black) / Fitted by 2PCs (dashed blue)")
lines(USyields$date,Y10.hat,col="blue",lty=2,lwd=2)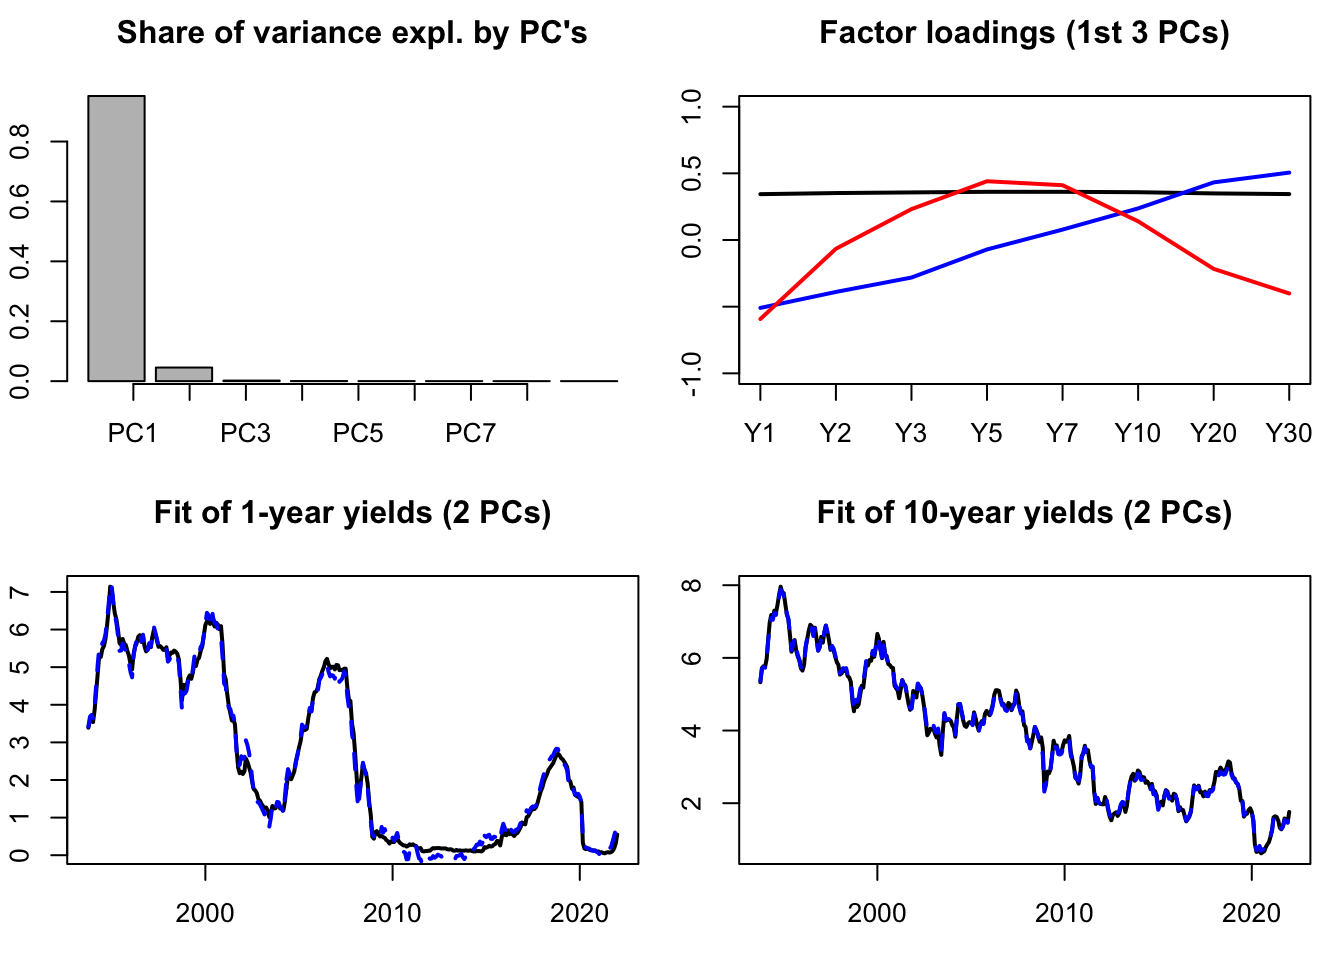
Figure 9.1: Some PCA results. The dataset contains 8 time series of U.S. interest rates of different maturities.
9.2 Linear algebra: definitions and results
This section records the matrix definitions and identities used in the regression and estimation chapters. It is organized as a reference rather than a continuous derivation.
Definition 9.1 (Eigenvalues) The eigenvalues of of a matrix \(M\) are the numbers \(\lambda\) for which: \[ |M - \lambda I| = 0, \] where \(| \bullet |\) is the determinant operator.
Proposition 9.1 (Properties of the determinant) We have:
- \(|MN|=|M|\times|N|\).
- \(|M^{-1}|=|M|^{-1}\).
- If \(M\) admits the diagonal representation \(M=TDT^{-1}\), where \(D\) is a diagonal matrix whose diagonal entries are \(\{\lambda_i\}_{i=1,\dots,n}\), then: \[ |M - \lambda I |=\prod_{i=1}^n (\lambda_i - \lambda). \]
Definition 9.2 (Moore-Penrose inverse) If \(M \in \mathbb{R}^{m \times n}\), then its Moore-Penrose pseudo inverse (exists and) is the unique matrix \(M^* \in \mathbb{R}^{n \times m}\) that satisfies:
- \(M M^* M = M\)
- \(M^* M M^* = M^*\)
- \((M M^*)'=M M^*\) .iv \((M^* M)'=M^* M\).
Proposition 9.2 (Properties of the Moore-Penrose inverse)
- If \(M\) is invertible then \(M^* = M^{-1}\).
- The pseudo-inverse of a zero matrix is its transpose. * The pseudo-inverse of the pseudo-inverse is the original matrix.
Definition 9.3 (Idempotent matrix) Matrix \(M\) is idempotent if \(M^2=M\).
If \(M\) is a symmetric idempotent matrix, then \(M'M=M\).
Proposition 9.3 (Roots of an idempotent matrix) The eigenvalues of an idempotent matrix are either 1 or 0.
Proof. If \(\lambda\) is an eigenvalue of an idempotent matrix \(M\) then \(\exists x \ne 0\) s.t. \(Mx=\lambda x\). Hence \(M^2x=\lambda M x \Rightarrow (1-\lambda)Mx=0\). Either all element of \(Mx\) are zero, in which case \(\lambda=0\) or at least one element of \(Mx\) is nonzero, in which case \(\lambda=1\).
Proposition 9.4 (Idempotent matrix and chi-square distribution) The rank of a symmetric idempotent matrix is equal to its trace.
Proof. The result follows from Prop. 9.3, combined with the fact that the rank of a symmetric matrix is equal to the number of its nonzero eigenvalues.
Proposition 9.5 (Constrained least squares) The solution of the following optimisation problem: \[\begin{eqnarray*} \underset{\boldsymbol\beta}{\min} && || \mathbf{y} - \mathbf{X}\boldsymbol\beta ||^2 \\ && \mbox{subject to } \mathbf{R}\boldsymbol\beta = \mathbf{q} \end{eqnarray*}\] is given by: \[ \boxed{\boldsymbol\beta^r = \boldsymbol\beta_0 - (\mathbf{X}'\mathbf{X})^{-1} \mathbf{R}'\{\mathbf{R}(\mathbf{X}'\mathbf{X})^{-1}\mathbf{R}'\}^{-1}(\mathbf{R}\boldsymbol\beta_0 - \mathbf{q}),} \] where \(\boldsymbol\beta_0=(\mathbf{X}'\mathbf{X})^{-1}\mathbf{X}'\mathbf{y}\).
Proof. See for instance Jackman, 2007.
Proposition 9.6 (Inverse of a partitioned matrix) We have: \[\begin{eqnarray*} &&\left[ \begin{array}{cc} \mathbf{A}_{11} & \mathbf{A}_{12} \\ \mathbf{A}_{21} & \mathbf{A}_{22} \end{array}\right]^{-1} = \\ &&\left[ \begin{array}{cc} (\mathbf{A}_{11} - \mathbf{A}_{12}\mathbf{A}_{22}^{-1}\mathbf{A}_{21})^{-1} & - \mathbf{A}_{11}^{-1}\mathbf{A}_{12}(\mathbf{A}_{22} - \mathbf{A}_{21}\mathbf{A}_{11}^{-1}\mathbf{A}_{12})^{-1} \\ -(\mathbf{A}_{22} - \mathbf{A}_{21}\mathbf{A}_{11}^{-1}\mathbf{A}_{12})^{-1}\mathbf{A}_{21}\mathbf{A}_{11}^{-1} & (\mathbf{A}_{22} - \mathbf{A}_{21}\mathbf{A}_{11}^{-1}\mathbf{A}_{12})^{-1} \end{array} \right]. \end{eqnarray*}\]
Definition 9.4 (Matrix derivatives) Consider a function \(f:\mathbb{R}^K\rightarrow\mathbb{R}\). Its first derivative is \[ \frac{\partial f}{\partial \mathbf{b}}(\mathbf{b}) = \left[\begin{array}{c} \frac{\partial f}{\partial b_1}(\mathbf{b})\\ \vdots\\ \frac{\partial f}{\partial b_K}(\mathbf{b}) \end{array} \right]. \] We use the notation: \[ \frac{\partial f}{\partial \mathbf{b}'}(\mathbf{b}) = \left(\frac{\partial f}{\partial \mathbf{b}}(\mathbf{b})\right)'. \]
Proposition 9.7 We have:
- If \(f(\mathbf{b}) = A' \mathbf{b}\) where \(A\) is a \(K \times 1\) vector then \(\frac{\partial f}{\partial \mathbf{b}}(\mathbf{b}) = A\).
- If \(f(\mathbf{b}) = \mathbf{b}'A\mathbf{b}\) where \(A\) is a \(K \times K\) matrix, then \(\frac{\partial f}{\partial \mathbf{b}}(\mathbf{b}) = (A+A')\mathbf{b}\). If \(A\) is symmetric, this simplifies to \(2A\mathbf{b}\).
Proposition 9.8 (Square and absolute summability) We have: \[ \underbrace{\sum_{i=0}^{\infty}|\theta_i| < + \infty}_{\mbox{Absolute summability}} \Rightarrow \underbrace{\sum_{i=0}^{\infty} \theta_i^2 < + \infty}_{\mbox{Square summability}}. \]
Proof. See Appendix 3.A in Hamilton. Idea: Absolute summability implies that there exist \(N\) such that, for \(j>N\), \(|\theta_j| < 1\) (deduced from Cauchy criterion, Theorem 9.2 and therefore \(\theta_j^2 < |\theta_j|\).
9.3 Statistical analysis: definitions and results
The following results collect moment identities, standard distributions, and modes of stochastic convergence used throughout the book.
9.3.1 Moments and statistics
Definition 9.5 (Partial correlation) The partial correlation between \(y\) and \(z\), controlling for some variables \(\mathbf{X}\) is the sample correlation between \(y^*\) and \(z^*\), where the latter two variables are the residuals in regressions of \(y\) on \(\mathbf{X}\) and of \(z\) on \(\mathbf{X}\), respectively.
This correlation is denoted by \(r_{yz}^\mathbf{X}\). By definition, we have: \[\begin{equation} r_{yz}^\mathbf{X} = \frac{\mathbf{z^*}'\mathbf{y^*}}{\sqrt{(\mathbf{z^*}'\mathbf{z^*})(\mathbf{y^*}'\mathbf{y^*})}}.\tag{9.2} \end{equation}\]
Definition 9.6 (Skewness and kurtosis) Let \(Y\) be a random variable whose fourth moment exists. The expectation of \(Y\) is denoted by \(\mu\).
- The skewness of \(Y\) is given by: \[ \frac{\mathbb{E}[(Y-\mu)^3]}{\{\mathbb{E}[(Y-\mu)^2]\}^{3/2}}. \]
- The kurtosis of \(Y\) is given by: \[ \frac{\mathbb{E}[(Y-\mu)^4]}{\{\mathbb{E}[(Y-\mu)^2]\}^{2}}. \]
Theorem 9.1 (Cauchy-Schwarz inequality) Assuming \(X\) and \(Y\) have finite variances, we have: \[ |\mathbb{C}ov(X,Y)| \le \sqrt{\mathbb{V}ar(X)\mathbb{V}ar(Y)} \] If both variances are non-zero, equality holds if and only if the centered variables are linearly dependent almost surely; equivalently, \(Y=aX+b\) almost surely for some constants \(a\) and \(b\).
Proof. If \(\mathbb{V}ar(X)=0\), this is trivial. If this is not the case, then let’s define \(Z\) as \(Z = Y - \frac{\mathbb{C}ov(X,Y)}{\mathbb{V}ar(X)}X\). It is easily seen that \(\mathbb{C}ov(X,Z)=0\). Then, the variance of \(Y=Z+\frac{\mathbb{C}ov(X,Y)}{\mathbb{V}ar(X)}X\) is equal to the sum of the variance of \(Z\) and of the variance of \(\frac{\mathbb{C}ov(X,Y)}{\mathbb{V}ar(X)}X\), that is: \[ \mathbb{V}ar(Y) = \mathbb{V}ar(Z) + \left(\frac{\mathbb{C}ov(X,Y)}{\mathbb{V}ar(X)}\right)^2\mathbb{V}ar(X) \ge \left(\frac{\mathbb{C}ov(X,Y)}{\mathbb{V}ar(X)}\right)^2\mathbb{V}ar(X). \] The equality holds iff \(\mathbb{V}ar(Z)=0\), i.e. iff \(Y = \frac{\mathbb{C}ov(X,Y)}{\mathbb{V}ar(X)}X+cst\).
Definition 9.7 (Asymptotic level) An asymptotic test with critical region \(\Omega_n\) has an asymptotic level equal to \(\alpha\) if: \[ \limsup_{n\rightarrow\infty}\;\sup_{\theta\in\Theta}\mathbb{P}_\theta(S_n\in\Omega_n)=\alpha, \] where \(S_n\) is the test statistic and \(\Theta\) is such that the null hypothesis \(H_0\) is equivalent to \(\theta \in \Theta\).
Definition 9.8 (Asymptotically consistent test) An asymptotic test with critical region \(\Omega_n\) is consistent if: \[ \forall \theta \in \Theta^c, \quad \mathbb{P}_\theta (S_n \in \Omega_n) \rightarrow 1, \] where \(S_n\) is the test statistic and \(\Theta^c\) is such that the null hypothesis \(H_0\) is equivalent to \(\theta \notin \Theta^c\).
Definition 9.9 (Kullback discrepancy) Given two p.d.f. \(f\) and \(f^*\), the Kullback discrepancy is defined by: \[ I(f,f^*) = \mathbb{E}^* \left( \log \frac{f^*(Y)}{f(Y)} \right) = \int \log \frac{f^*(y)}{f(y)} f^*(y) dy. \]
Proposition 9.9 (Properties of the Kullback discrepancy) We have:
- \(I(f,f^*) \ge 0\)
- \(I(f,f^*) = 0\) iff \(f \equiv f^*\).
Proof. \(x \rightarrow -\log(x)\) is a convex function. Therefore \(\mathbb{E}^*(-\log f(Y)/f^*(Y)) \ge -\log \mathbb{E}^*(f(Y)/f^*(Y)) = 0\) (proves (i)). Since \(x \rightarrow -\log(x)\) is strictly convex, equality in (i) holds if and only if \(f(Y)/f^*(Y)\) is constant (proves (ii)).
Definition 9.10 (Characteristic function) For any real-valued random variable \(X\), the characteristic function is defined by: \[ \phi_X: u \rightarrow \mathbb{E}[\exp(iuX)]. \]
9.3.2 Standard distributions
Definition 9.11 (F distribution) Consider \(n=n_1+n_2\) i.i.d. \(\mathcal{N}(0,1)\) r.v. \(X_i\). If the r.v. \(F\) is defined by: \[ F = \frac{\sum_{i=1}^{n_1} X_i^2}{\sum_{j=n_1+1}^{n_1+n_2} X_j^2}\frac{n_2}{n_1} \] then \(F \sim \mathcal{F}(n_1,n_2)\). (See Table 9.4 for quantiles.)
Definition 9.12 (Student-t distribution) \(Z\) follows a Student-t (or \(t\)) distribution with \(\nu\) degrees of freedom (d.f.) if: \[ Z = X_0 \bigg/ \sqrt{\frac{\sum_{i=1}^{\nu}X_i^2}{\nu}}, \quad X_i \sim i.i.d. \mathcal{N}(0,1). \] We have \(\mathbb{E}(Z)=0\), and \(\mathbb{V}ar(Z)=\frac{\nu}{\nu-2}\) if \(\nu>2\). (See Table 9.2 for quantiles.)
Definition 9.13 (Chi-square distribution) \(Z\) follows a \(\chi^2\) distribution with \(\nu\) d.f. if \(Z = \sum_{i=1}^{\nu}X_i^2\) where \(X_i \sim i.i.d. \mathcal{N}(0,1)\). We have \(\mathbb{E}(Z)=\nu\). (See Table 9.3 for quantiles.)
Definition 9.14 (Cauchy distribution)
The probability distribution function of the Cauchy distribution defined by a location parameter \(\mu\) and a scale parameter \(\gamma\) is: \[ f(x) = \frac{1}{\pi \gamma \left(1 + \left[\frac{x-\mu}{\gamma}\right]^2\right)}. \] The mean and variance of this distribution are undefined.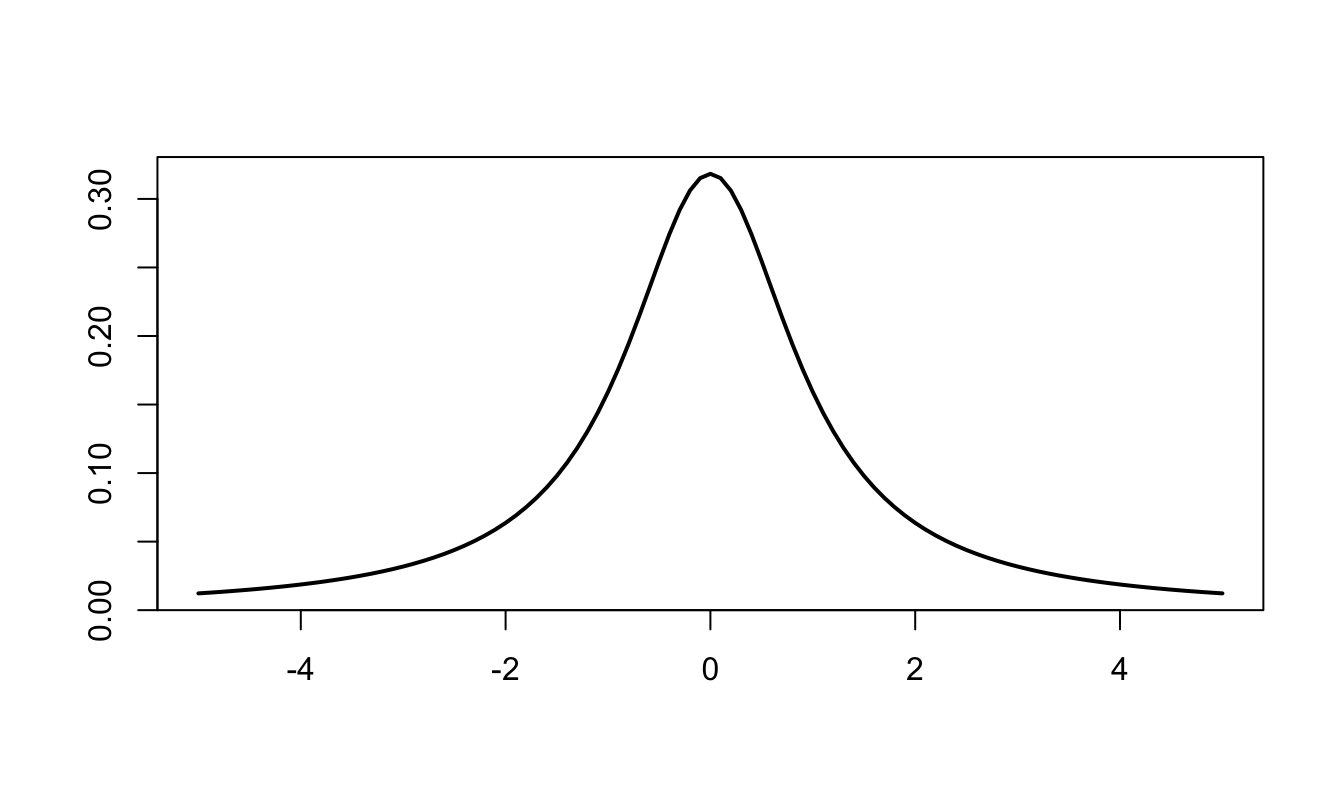
Figure 9.2: Pdf of the Cauchy distribution (\(\mu=0\), \(\gamma=1\)).
Proposition 9.10 (Inner product of a multivariate Gaussian variable) Let \(X\) be a \(n\)-dimensional multivariate Gaussian variable: \(X \sim \mathcal{N}(0,\Sigma)\). We have: \[ X' \Sigma^{-1}X \sim \chi^2(n). \]
Proof. Because \(\Sigma\) is a symmetrical definite positive matrix, it admits the spectral decomposition \(PDP'\) where \(P\) is an orthogonal matrix (i.e. \(PP'=Id\)) and D is a diagonal matrix with non-negative entries. Denoting by \(\sqrt{D^{-1}}\) the diagonal matrix whose diagonal entries are the inverse of those of \(D\), it is easily checked that the covariance matrix of \(Y:=\sqrt{D^{-1}}P'X\) is \(Id\). Therefore \(Y\) is a vector of uncorrelated Gaussian variables. The properties of Gaussian variables imply that the components of \(Y\) are then also independent. Hence \(Y'Y=\sum_i Y_i^2 \sim \chi^2(n)\).
It remains to note that \(Y'Y=X'PD^{-1}P'X=X'\mathbb{V}ar(X)^{-1}X\) to conclude.
Definition 9.15 (Generalized Extreme Value (GEV) distribution) The vector of disturbances \(\boldsymbol\varepsilon=[\varepsilon_{1,1},\dots,\varepsilon_{1,K_1},\dots,\varepsilon_{J,1},\dots,\varepsilon_{J,K_J}]'\) follows the Generalized Extreme Value (GEV) distribution if its c.d.f. is: \[ F(\boldsymbol\varepsilon,\boldsymbol\rho) = \exp(-G(e^{-\varepsilon_{1,1}},\dots,e^{-\varepsilon_{J,K_J}};\boldsymbol\rho)) \] with \[\begin{eqnarray*} G(\mathbf{Y};\boldsymbol\rho) &\equiv& G(Y_{1,1},\dots,Y_{1,K_1},\dots,Y_{J,1},\dots,Y_{J,K_J};\boldsymbol\rho) \\ &=& \sum_{j=1}^J\left(\sum_{k=1}^{K_j} Y_{jk}^{1/\rho_j} \right)^{\rho_j} \end{eqnarray*}\]
9.3.3 Stochastic convergences
Proposition 9.11 (Chebychev's inequality) If \(\mathbb{E}(|X|^r)\) is finite for some \(r>0\) then: \[ \forall \varepsilon > 0, \quad \mathbb{P}(|X - c|>\varepsilon) \le \frac{\mathbb{E}[|X - c|^r]}{\varepsilon^r}. \] In particular, for \(r=2\): \[ \forall \varepsilon > 0, \quad \mathbb{P}(|X - c|>\varepsilon) \le \frac{\mathbb{E}[(X - c)^2]}{\varepsilon^2}. \]
Proof. Remark that \(\varepsilon^r \mathbb{I}_{\{|X-c| \ge \varepsilon\}} \le |X-c|^r\) and take the expectation of both sides.
Definition 9.16 (Convergence in probability) The random variable sequence \(x_n\) converges in probability to a constant \(c\) if, for every \(\varepsilon>0\), \(\lim_{n \rightarrow \infty} \mathbb{P}(|x_n - c|>\varepsilon) = 0\).
It is denoted as: \(\mbox{plim } x_n = c\).
Definition 9.17 (Convergence in the Lr norm) \(x_n\) converges in the \(r\)-th mean (or in the \(L^r\)-norm) towards \(x\), if \(\mathbb{E}(|x_n|^r)\) and \(\mathbb{E}(|x|^r)\) exist and if \[ \lim_{n \rightarrow \infty} \mathbb{E}(|x_n - x|^r) = 0. \] It is denoted as: \(x_n \overset{L^r}{\rightarrow} x\).
For \(r=2\), this convergence is called mean square convergence.
Definition 9.18 (Almost sure convergence) The random variable sequence \(x_n\) converges almost surely to \(c\) if \(\mathbb{P}(\lim_{n \rightarrow \infty} x_n = c) = 1\).
It is denoted as: \(x_n \overset{a.s.}{\rightarrow} c\).
Definition 9.19 (Convergence in distribution) \(x_n\) is said to converge in distribution (or in law) to \(x\) if \[ \lim_{n \rightarrow \infty} F_{x_n}(s) = F_{x}(s) \] for all \(s\) at which \(F_X\) –the cumulative distribution of \(X\)– is continuous.
It is denoted as: \(x_n \overset{d}{\rightarrow} x\).
Proposition 9.12 (Rules for limiting distributions (Slutsky)) We have:
Slutsky’s theorem: If \(x_n \overset{d}{\rightarrow} x\) and \(y_n \overset{p}{\rightarrow} c\) then \[\begin{eqnarray*} x_n y_n &\overset{d}{\rightarrow}& x c \\ x_n + y_n &\overset{d}{\rightarrow}& x + c \\ x_n/y_n &\overset{d}{\rightarrow}& x / c \quad (\mbox{if }c \ne 0) \end{eqnarray*}\]
Continuous mapping theorem: If \(x_n \overset{d}{\rightarrow} x\) and \(g\) is a continuous function then \(g(x_n) \overset{d}{\rightarrow} g(x).\)
Proposition 9.13 (Implications of stochastic convergences) We have: \[\begin{align*} &\boxed{\overset{L^s}{\rightarrow}}& &\underset{1 \le r \le s}{\Rightarrow}& &\boxed{\overset{L^r}{\rightarrow}}&\\ && && &\Downarrow&\\ &\boxed{\overset{a.s.}{\rightarrow}}& &\Rightarrow& &\boxed{\overset{p}{\rightarrow}}& \Rightarrow \qquad \boxed{\overset{d}{\rightarrow}}. \end{align*}\]
Proof. (of the fact that \(\left(\overset{p}{\rightarrow}\right) \Rightarrow \left( \overset{d}{\rightarrow}\right)\)). Assume that \(X_n \overset{p}{\rightarrow} X\). Denoting by \(F\) and \(F_n\) the c.d.f. of \(X\) and \(X_n\), respectively: \[\begin{eqnarray*} F_n(x) &=& \mathbb{P}(X_n \le x,X\le x+\varepsilon) + \mathbb{P}(X_n \le x,X > x+\varepsilon)\\ &\le& F(x+\varepsilon) + \mathbb{P}(|X_n - X|>\varepsilon).\tag{9.3} \end{eqnarray*}\] Besides, \[\begin{eqnarray*} F(x-\varepsilon) &=& \mathbb{P}(X \le x-\varepsilon,X_n \le x) + \mathbb{P}(X \le x-\varepsilon,X_n > x)\\ &\le& F_n(x) + \mathbb{P}(|X_n - X|>\varepsilon), \end{eqnarray*}\] which implies: \[\begin{equation} F(x-\varepsilon) - \mathbb{P}(|X_n - X|>\varepsilon) \le F_n(x).\tag{9.4} \end{equation}\] Eqs. (9.3) and (9.4) imply: \[ F(x-\varepsilon) - \mathbb{P}(|X_n - X|>\varepsilon) \le F_n(x) \le F(x+\varepsilon) + \mathbb{P}(|X_n - X|>\varepsilon). \] Taking limits as \(n \rightarrow \infty\) yields \[ F(x-\varepsilon) \le \underset{n \rightarrow \infty}{\mbox{lim inf}}\; F_n(x) \le \underset{n \rightarrow \infty}{\mbox{lim sup}}\; F_n(x) \le F(x+\varepsilon). \] The result is then obtained by taking limits as \(\varepsilon \rightarrow 0\) (if \(F\) is continuous at \(x\)).
Proposition 9.14 (Convergence in distribution to a constant) If \(X_n\) converges in distribution to a constant \(c\), then \(X_n\) converges in probability to \(c\).
Proof. If \(\varepsilon>0\), we have \(\mathbb{P}(X_n < c - \varepsilon) \underset{n \rightarrow \infty}{\rightarrow} 0\) i.e. \(\mathbb{P}(X_n \ge c - \varepsilon) \underset{n \rightarrow \infty}{\rightarrow} 1\) and \(\mathbb{P}(X_n < c + \varepsilon) \underset{n \rightarrow \infty}{\rightarrow} 1\). Therefore \(\mathbb{P}(c - \varepsilon \le X_n < c + \varepsilon) \underset{n \rightarrow \infty}{\rightarrow} 1\), which gives the result.
Example 9.1 (Convergence in probability but not $L^r$) Let \(\{x_n\}_{n \in \mathbb{N}}\) be a series of random variables defined by: \[ x_n = n u_n, \] where \(u_n\) are independent random variables s.t. \(u_n \sim \mathcal{B}(1/n)\).
We have \(x_n \overset{p}{\rightarrow} 0\) but \(x_n \overset{L^r}{\nrightarrow} 0\) because \(\mathbb{E}(|X_n-0|)=\mathbb{E}(X_n)=1\).
Theorem 9.2 (Cauchy criterion (non-stochastic case)) We have that \(\sum_{i=0}^{T} a_i\) converges (\(T \rightarrow \infty\)) iff, for any \(\eta > 0\), there exists an integer \(N\) such that, for all \(M\ge N\), \[ \left|\sum_{i=N+1}^{M} a_i\right| < \eta. \]
Theorem 9.3 (Cauchy criterion (stochastic case)) We have that \(\sum_{i=0}^{T} \theta_i \varepsilon_{t-i}\) converges in mean square (\(T \rightarrow \infty\)) to a random variable iff, for any \(\eta > 0\), there exists an integer \(N\) such that, for all \(M\ge N\), \[ \mathbb{E}\left[\left(\sum_{i=N+1}^{M} \theta_i \varepsilon_{t-i}\right)^2\right] < \eta. \]
9.3.4 Central limit theorem
Theorem 9.4 (Law of large numbers) The sample mean is a consistent estimator of the population mean.
Proof. Let’s denote by \(\phi_{X_i}\) the characteristic function of a r.v. \(X_i\). If the mean of \(X_i\) is \(\mu\) then the Talyor expansion of the characteristic function is: \[ \phi_{X_i}(u) = \mathbb{E}(\exp(iuX)) = 1 + iu\mu + o(u). \] The properties of the characteristic function (see Def. 9.10) imply that: \[ \phi_{\frac{1}{n}(X_1+\dots+X_n)}(u) = \prod_{i=1}^{n} \left(1 + i\frac{u}{n}\mu + o\left(\frac{u}{n}\right) \right) \rightarrow e^{iu\mu}. \] The facts that (a) \(e^{iu\mu}\) is the characteristic function of the constant \(\mu\) and (b) that a characteristic function uniquely characterises a distribution imply that the sample mean converges in distribution to the constant \(\mu\), which further implies that it converges in probability to \(\mu\).
Theorem 9.5 (Lindberg-Levy Central limit theorem, CLT) If \(x_n\) is an i.i.d. sequence of random variables with mean \(\mu\) and variance \(\sigma^2\) (\(\in ]0,+\infty[\)), then: \[ \boxed{\sqrt{n} (\bar{x}_n - \mu) \overset{d}{\rightarrow} \mathcal{N}(0,\sigma^2), \quad \mbox{where} \quad \bar{x}_n = \frac{1}{n} \sum_{i=1}^{n} x_i.} \]
Proof. Let us introduce the r.v. \(Y_n:= \sqrt{n}(\bar{X}_n - \mu)\). We have \(\phi_{Y_n}(u) = \left[ \mathbb{E}\left( \exp(i \frac{1}{\sqrt{n}} u (X_1 - \mu)) \right) \right]^n\). We have: \[\begin{eqnarray*} &&\left[ \mathbb{E}\left( \exp\left(i \frac{1}{\sqrt{n}} u (X_1 - \mu)\right) \right) \right]^n\\ &=& \left[ \mathbb{E}\left( 1 + i \frac{1}{\sqrt{n}} u (X_1 - \mu) - \frac{1}{2n} u^2 (X_1 - \mu)^2 + o(u^2) \right) \right]^n \\ &=& \left( 1 - \frac{1}{2n}u^2\sigma^2 + o(u^2)\right)^n. \end{eqnarray*}\] Therefore \(\phi_{Y_n}(u) \underset{n \rightarrow \infty}{\rightarrow} \exp \left( - \frac{1}{2}u^2\sigma^2 \right)\), which is the characteristic function of \(\mathcal{N}(0,\sigma^2)\).
9.4 Some properties of Gaussian variables
Gaussian variables recur in finite-sample regression theory, likelihood calculations, and forecasting. This section gathers the conditioning and truncation formulas needed in those applications.
Proposition 9.15 If \(\mathbf{A}\) is idempotent and if \(\mathbf{x}\) is Gaussian, \(\mathbf{L}\mathbf{x}\) and \(\mathbf{x}'\mathbf{A}\mathbf{x}\) are independent if \(\mathbf{L}\mathbf{A}=\mathbf{0}\).
Proof. If \(\mathbf{L}\mathbf{A}=\mathbf{0}\), then the Gaussian vectors \(\mathbf{L}\mathbf{x}\) and \(\mathbf{A}\mathbf{x}\) are independent, as are any functions of those vectors. The result follows because \(\mathbf{x}'\mathbf{A}\mathbf{x}=(\mathbf{A}\mathbf{x})'(\mathbf{A}\mathbf{x})\) is a function of \(\mathbf{A}\mathbf{x}\).
Proposition 9.16 (Bayesian update in a vector of Gaussian variables) If \[ \left[ \begin{array}{c} Y_1\\ Y_2 \end{array} \right] \sim \mathcal{N} \left(0, \left[\begin{array}{cc} \Omega_{11} & \Omega_{12}\\ \Omega_{21} & \Omega_{22} \end{array}\right] \right), \] then \[ Y_{2}|Y_{1} \sim \mathcal{N} \left( \Omega_{21}\Omega_{11}^{-1}Y_{1},\Omega_{22}-\Omega_{21}\Omega_{11}^{-1}\Omega_{12} \right). \] \[ Y_{1}|Y_{2} \sim \mathcal{N} \left( \Omega_{12}\Omega_{22}^{-1}Y_{2},\Omega_{11}-\Omega_{12}\Omega_{22}^{-1}\Omega_{21} \right). \]
Proposition 9.17 (Truncated distributions) If \(X\) is a random variable distributed according to some p.d.f. \(f\), with c.d.f. \(F\), with infinite support. Then the p.d.f. of \(X|a \le X < b\) is \[ g(x) = \frac{f(x)}{F(b)-F(a)}\mathbb{I}_{\{a \le x < b\}}, \] for any \(a<b\).
In partiucular, for a Gaussian variable \(X \sim \mathcal{N}(\mu,\sigma^2)\), we have \[ f(X=x|a\le X<b) = \dfrac{\dfrac{1}{\sigma}\phi\left(\dfrac{x - \mu}{\sigma}\right)}{Z}. \] with \(Z = \Phi(\beta)-\Phi(\alpha)\), where \(\alpha = \dfrac{a - \mu}{\sigma}\) and \(\beta = \dfrac{b - \mu}{\sigma}\).
Moreover: \[\begin{eqnarray} \mathbb{E}(X|a\le X<b) &=& \mu - \frac{\phi\left(\beta\right)-\phi\left(\alpha\right)}{Z}\sigma. \tag{9.5} \end{eqnarray}\]
We also have: \[\begin{eqnarray} && \mathbb{V}ar(X|a\le X<b) \nonumber\\ &=& \sigma^2\left[ 1 - \frac{\beta\phi\left(\beta\right)-\alpha\phi\left(\alpha\right)}{Z} - \left(\frac{\phi\left(\beta\right)-\phi\left(\alpha\right)}{Z}\right)^2 \right] \tag{9.6} \end{eqnarray}\]
In particular, for \(b \rightarrow \infty\), we get: \[\begin{equation} \mathbb{V}ar(X|a < X) = \sigma^2\left[1 + \alpha\lambda(-\alpha) - \lambda(-\alpha)^2 \right], \tag{9.7} \end{equation}\] with \(\lambda(x)=\dfrac{\phi(x)}{\Phi(x)}\) is called the inverse Mills ratio.
Consider the case where \(a \rightarrow - \infty\) (i.e. the conditioning set is \(X<b\)) and \(\mu=0\), \(\sigma=1\). Then Eq. (9.5) gives \(\mathbb{E}(X|X<b) = - \lambda(b) = - \dfrac{\phi(b)}{\Phi(b)}\), where \(\lambda\) is the function computing the inverse Mills ratio.
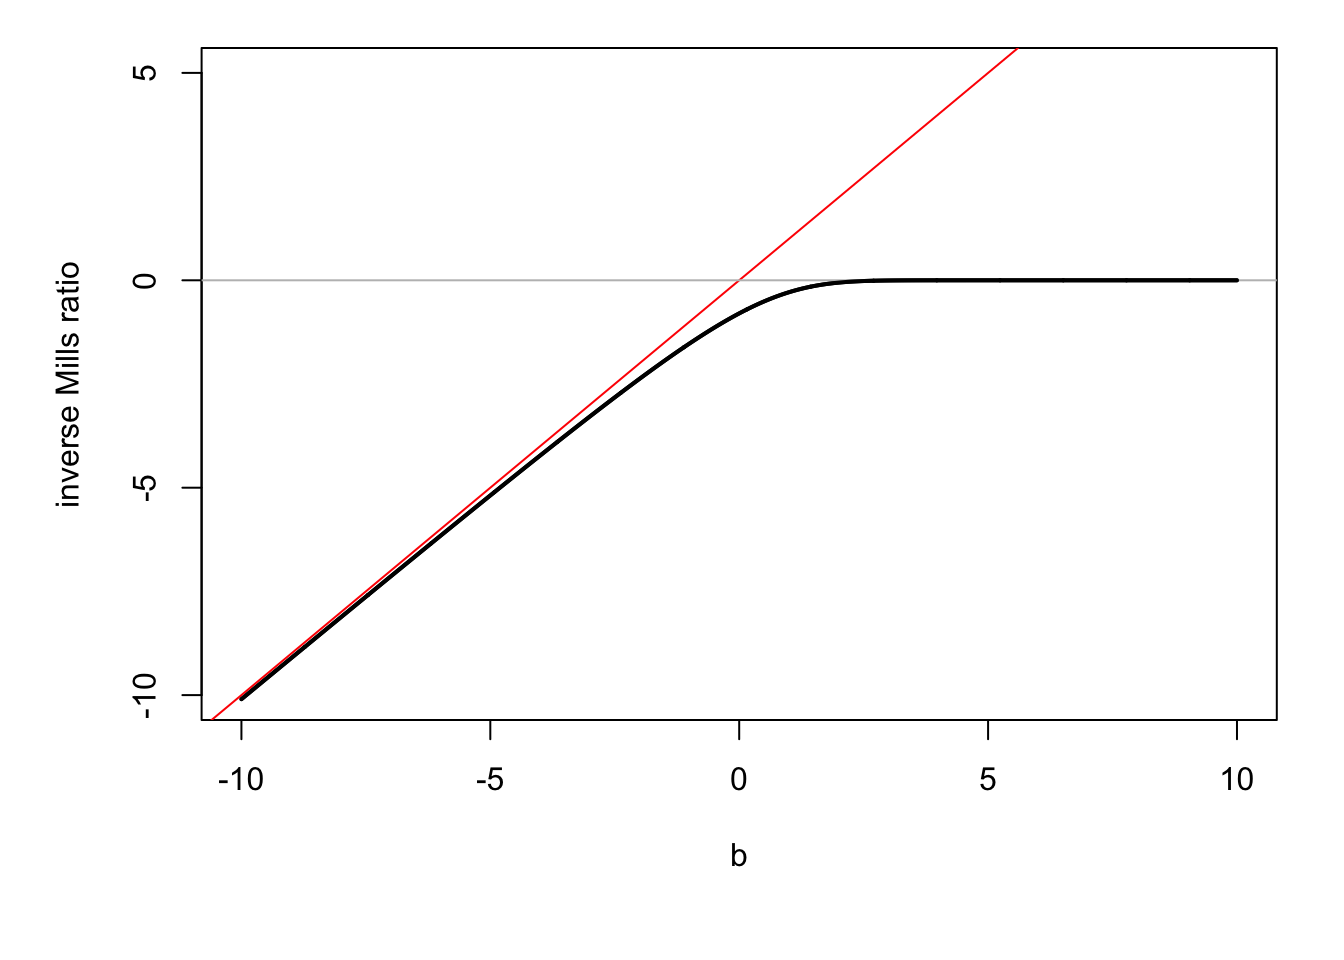
Figure 9.3: \(\mathbb{E}(X|X<b)\) as a function of \(b\) when \(X\sim \mathcal{N}(0,1)\) (in black).
Proposition 9.18 (p.d.f. of a multivariate Gaussian variable) If \(Y \sim \mathcal{N}(\mu,\Omega)\), \(Y\) is an \(n\)-dimensional vector, and \(\Omega\) is positive definite, then the density function of \(Y\) is: \[ \frac{1}{(2 \pi)^{n/2}|\Omega|^{1/2}}\exp\left[-\frac{1}{2}\left(Y-\mu\right)'\Omega^{-1}\left(Y-\mu\right)\right]. \]
9.5 Proofs
The proofs below support results stated in the main chapters. They are collected here to keep the exposition there focused on interpretation and application.
Proof of Proposition 6.4
Proof. Assumptions (i) and (ii) (in the set of Assumptions 6.1) imply that \(\boldsymbol\theta_{MLE}\) exists (\(=\mbox{argmax}_\theta (1/n)\log \mathcal{L}(\boldsymbol\theta;\mathbf{y})\)).
\((1/n)\log \mathcal{L}(\boldsymbol\theta;\mathbf{y})\) can be interpreted as the sample mean of the r.v. \(\log f(Y_i;\boldsymbol\theta)\) that are i.i.d. Therefore \((1/n)\log \mathcal{L}(\boldsymbol\theta;\mathbf{y})\) converges to \(\mathbb{E}_{\boldsymbol\theta_0}(\log f(Y;\boldsymbol\theta))\) – which exists (Assumption iv).
Because the latter convergence is uniform (Assumption v), the solution \(\boldsymbol\theta_{MLE}\) almost surely converges to the solution to the limit problem: \[ \mbox{argmax}_\theta \mathbb{E}_{\boldsymbol\theta_0}(\log f(Y;\boldsymbol\theta)) = \mbox{argmax}_\theta \int_{\mathcal{Y}} \log f(y;\boldsymbol\theta)f(y;\boldsymbol\theta_0) dy. \]
The properties of the Kullback information measure (see Prop. 9.9), together with the identifiability assumption (ii), imply that the solution to the limit problem is unique and equal to \(\boldsymbol\theta_0\).
Consider a random-vector sequence \(\boldsymbol\theta\) that converges to \(\boldsymbol\theta_0\). A Taylor expansion of the score around \(\boldsymbol\theta_0\) gives \[ \frac{\partial \log \mathcal{L}(\boldsymbol\theta;\mathbf{y})}{\partial \boldsymbol\theta} = \frac{\partial \log \mathcal{L}(\boldsymbol\theta_0;\mathbf{y})}{\partial \boldsymbol\theta} + \frac{\partial^2 \log \mathcal{L}(\boldsymbol\theta_0;\mathbf{y})}{\partial \boldsymbol\theta \partial \boldsymbol\theta'}(\boldsymbol\theta - \boldsymbol\theta_0) + o_p(\boldsymbol\theta - \boldsymbol\theta_0) \]
\(\boldsymbol\theta_{MLE}\) converges to \(\boldsymbol\theta_0\) and satisfies the likelihood equation \(\frac{\partial \log \mathcal{L}(\boldsymbol\theta;\mathbf{y})}{\partial \boldsymbol\theta} = \mathbf{0}\). Therefore: \[ \frac{\partial \log \mathcal{L}(\boldsymbol\theta_0;\mathbf{y})}{\partial \boldsymbol\theta} \approx - \frac{\partial^2 \log \mathcal{L}(\boldsymbol\theta_0;\mathbf{y})}{\partial \boldsymbol\theta \partial \boldsymbol\theta'}(\boldsymbol\theta_{MLE} - \boldsymbol\theta_0), \] or equivalently: \[ \frac{1}{\sqrt{n}} \frac{\partial \log \mathcal{L}(\boldsymbol\theta_0;\mathbf{y})}{\partial \boldsymbol\theta} \approx \left(- \frac{1}{n} \sum_{i=1}^n \frac{\partial^2 \log f(y_i;\boldsymbol\theta_0)}{\partial \boldsymbol\theta \partial \boldsymbol\theta'} \right)\sqrt{n}(\boldsymbol\theta_{MLE} - \boldsymbol\theta_0), \]
By the law of large numbers, we have: \(\left(- \frac{1}{n} \sum_{i=1}^n \frac{\partial^2 \log f(y_i;\boldsymbol\theta_0)}{\partial \boldsymbol\theta \partial \boldsymbol\theta'} \right) \overset{}\rightarrow \frac{1}{n} \mathbf{I}(\boldsymbol\theta_0) = \mathcal{I}_Y(\boldsymbol\theta_0)\).
Besides, we have: \[\begin{eqnarray*} \frac{1}{\sqrt{n}} \frac{\partial \log \mathcal{L}(\boldsymbol\theta_0;\mathbf{y})}{\partial \boldsymbol\theta} &=& \sqrt{n} \left( \frac{1}{n} \sum_i \frac{\partial \log f(y_i;\boldsymbol\theta_0)}{\partial \boldsymbol\theta} \right) \\ &=& \sqrt{n} \left( \frac{1}{n} \sum_i \left\{ \frac{\partial \log f(y_i;\boldsymbol\theta_0)}{\partial \boldsymbol\theta} - \mathbb{E}_{\boldsymbol\theta_0} \frac{\partial \log f(Y_i;\boldsymbol\theta_0)}{\partial \boldsymbol\theta} \right\} \right) \end{eqnarray*}\] which converges to \(\mathcal{N}(0,\mathcal{I}_Y(\boldsymbol\theta_0))\) by the CLT.
Collecting the preceding results leads to (b). The fact that \(\boldsymbol\theta_{MLE}\) achieves the FDCR bound proves (c).
Proof of Proposition 6.5
Proof. We have \(\sqrt{n}(\hat{\boldsymbol\theta}_{n} - \boldsymbol\theta_{0}) \overset{d}{\rightarrow} \mathcal{N}(0,\mathcal{I}(\boldsymbol\theta_0)^{-1})\) (Eq. (6.9)). A Taylor expansion around \(\boldsymbol\theta_0\) gives \[\begin{equation} \sqrt{n}(h(\hat{\boldsymbol\theta}_{n}) - h(\boldsymbol\theta_{0})) \overset{d}{\rightarrow} \mathcal{N}\left(0,\frac{\partial h(\boldsymbol\theta_{0})}{\partial \boldsymbol\theta'}\mathcal{I}(\boldsymbol\theta_0)^{-1}\frac{\partial h(\boldsymbol\theta_{0})'}{\partial \boldsymbol\theta}\right). \tag{9.8} \end{equation}\] Under \(H_0\), \(h(\boldsymbol\theta_{0})=0\) therefore: \[\begin{equation} \sqrt{n} h(\hat{\boldsymbol\theta}_{n}) \overset{d}{\rightarrow} \mathcal{N}\left(0,\frac{\partial h(\boldsymbol\theta_{0})}{\partial \boldsymbol\theta'}\mathcal{I}(\boldsymbol\theta_0)^{-1}\frac{\partial h(\boldsymbol\theta_{0})'}{\partial \boldsymbol\theta}\right). \tag{9.9} \end{equation}\] Hence \[ \sqrt{n} \left( \frac{\partial h(\boldsymbol\theta_{0})}{\partial \boldsymbol\theta'}\mathcal{I}(\boldsymbol\theta_0)^{-1}\frac{\partial h(\boldsymbol\theta_{0})'}{\partial \boldsymbol\theta} \right)^{-1/2} h(\hat{\boldsymbol\theta}_{n}) \overset{d}{\rightarrow} \mathcal{N}\left(0,Id\right). \] Taking the quadratic form, we obtain: \[ n h(\hat{\boldsymbol\theta}_{n})' \left( \frac{\partial h(\boldsymbol\theta_{0})}{\partial \boldsymbol\theta'}\mathcal{I}(\boldsymbol\theta_0)^{-1}\frac{\partial h(\boldsymbol\theta_{0})'}{\partial \boldsymbol\theta} \right)^{-1} h(\hat{\boldsymbol\theta}_{n}) \overset{d}{\rightarrow} \chi^2(r). \]
The preceding result establishes asymptotic level \(\alpha\). For consistency, consider \(\theta_0 \in \Theta\) under the alternative. Because the MLE is consistent, \(h(\hat{\boldsymbol\theta}_{n})\) converges to \(h(\boldsymbol\theta_0) \ne 0\). Equation (9.8) then implies that \(\xi^W_n\) diverges to \(+\infty\), so \(\mathbb{P}_{\boldsymbol\theta}(\xi^W_n \ge \chi^2_{1-\alpha}(r)) \rightarrow 1\).
Proof of Proposition 6.6
Proof. Notations: “\(\approx\)” means “equal up to a term that converges to 0 in probability”. We are under \(H_0\). \(\hat{\boldsymbol\theta}^0\) is the constrained ML estimator; \(\hat{\boldsymbol\theta}\) denotes the unconstrained one.
We combine the two Taylor expansion: \(h(\hat{\boldsymbol\theta}_n) \approx \dfrac{\partial h(\boldsymbol\theta_0)}{\partial \boldsymbol\theta'}(\hat{\boldsymbol\theta}_n - \boldsymbol\theta_0)\) and \(h(\hat{\boldsymbol\theta}_n^0) \approx \dfrac{\partial h(\boldsymbol\theta_0)}{\partial \boldsymbol\theta'}(\hat{\boldsymbol\theta}_n^0 - \boldsymbol\theta_0)\) and we use \(h(\hat{\boldsymbol\theta}_n^0)=0\) (by definition) to get: \[\begin{equation} \sqrt{n}h(\hat{\boldsymbol\theta}_n) \approx \dfrac{\partial h(\boldsymbol\theta_0)}{\partial \boldsymbol\theta'}\sqrt{n}(\hat{\boldsymbol\theta}_n - \hat{\boldsymbol\theta}^0_n). \tag{9.10} \end{equation}\] Besides, we have (using the definition of the information matrix): \[\begin{equation} \frac{1}{\sqrt{n}}\frac{\partial \log \mathcal{L}(\hat{\boldsymbol\theta}^0_n;\mathbf{y})}{\partial \boldsymbol\theta} \approx \frac{1}{\sqrt{n}}\frac{\partial \log \mathcal{L}(\boldsymbol\theta_0;\mathbf{y})}{\partial \boldsymbol\theta} - \mathcal{I}(\boldsymbol\theta_0)\sqrt{n}(\hat{\boldsymbol\theta}^0_n-\boldsymbol\theta_0) \tag{9.11} \end{equation}\] and: \[\begin{equation} 0=\frac{1}{\sqrt{n}}\frac{\partial \log \mathcal{L}(\hat{\boldsymbol\theta}_n;\mathbf{y})}{\partial \boldsymbol\theta} \approx \frac{1}{\sqrt{n}}\frac{\partial \log \mathcal{L}(\boldsymbol\theta_0;\mathbf{y})}{\partial \boldsymbol\theta} - \mathcal{I}(\boldsymbol\theta_0)\sqrt{n}(\hat{\boldsymbol\theta}_n-\boldsymbol\theta_0).\tag{9.12} \end{equation}\] Taking the difference and multiplying by \(\mathcal{I}(\boldsymbol\theta_0)^{-1}\): \[\begin{equation} \sqrt{n}(\hat{\boldsymbol\theta}_n-\hat{\boldsymbol\theta}_n^0) \approx \mathcal{I}(\boldsymbol\theta_0)^{-1}\frac{1}{\sqrt{n}}\frac{\partial \log \mathcal{L}(\hat{\boldsymbol\theta}^0_n;\mathbf{y})}{\partial \boldsymbol\theta}.\tag{9.13} \end{equation}\] Eqs. (9.10) and (9.13) yield to: \[\begin{equation} \sqrt{n}h(\hat{\boldsymbol\theta}_n) \approx \dfrac{\partial h(\boldsymbol\theta_0)}{\partial \boldsymbol\theta'} \mathcal{I}(\boldsymbol\theta_0)^{-1}\frac{1}{\sqrt{n}}\frac{\partial \log \mathcal{L}(\hat{\boldsymbol\theta}^0_n;\mathbf{y})}{\partial \boldsymbol\theta}.\tag{9.14} \end{equation}\]
Recall that \(\hat{\boldsymbol\theta}^0_n\) is the MLE of \(\boldsymbol\theta_0\) under the constraint \(h(\boldsymbol\theta)=0\). The vector of Lagrange multipliers \(\hat\lambda_n\) associated to this program satisfies: \[\begin{equation} \frac{\partial \log \mathcal{L}(\hat{\boldsymbol\theta}^0_n;\mathbf{y})}{\partial \boldsymbol\theta}+ \frac{\partial h'(\hat{\boldsymbol\theta}^0_n;\mathbf{y})}{\partial \boldsymbol\theta}\hat\lambda_n = 0.\tag{9.15} \end{equation}\] Substituting the latter equation in Eq. (9.14) gives: \[\begin{eqnarray*} \sqrt{n}h(\hat{\boldsymbol\theta}_n) &\approx& - \dfrac{\partial h(\boldsymbol\theta_0)}{\partial \boldsymbol\theta'} \mathcal{I}(\boldsymbol\theta_0)^{-1} \frac{\partial h'(\hat{\boldsymbol\theta}^0_n;\mathbf{y})}{\partial \boldsymbol\theta} \frac{\hat\lambda_n}{\sqrt{n}} \\ &\approx& - \dfrac{\partial h(\boldsymbol\theta_0)}{\partial \boldsymbol\theta'} \mathcal{I}(\boldsymbol\theta_0)^{-1} \frac{\partial h'(\boldsymbol\theta_0;\mathbf{y})}{\partial \boldsymbol\theta} \frac{\hat\lambda_n}{\sqrt{n}}, \end{eqnarray*}\] which yields: \[\begin{equation} \frac{\hat\lambda_n}{\sqrt{n}} \approx - \left( \dfrac{\partial h(\boldsymbol\theta_0)}{\partial \boldsymbol\theta'} \mathcal{I}(\boldsymbol\theta_0)^{-1} \frac{\partial h'(\boldsymbol\theta_0;\mathbf{y})}{\partial \boldsymbol\theta} \right)^{-1} \sqrt{n}h(\hat{\boldsymbol\theta}_n).\tag{9.16} \end{equation}\] It follows, from Eq. (9.9), that: \[ \frac{\hat\lambda_n}{\sqrt{n}} \overset{d}{\rightarrow} \mathcal{N}\left(0,\left( \dfrac{\partial h(\boldsymbol\theta_0)}{\partial \boldsymbol\theta'} \mathcal{I}(\boldsymbol\theta_0)^{-1} \frac{\partial h'(\boldsymbol\theta_0;\mathbf{y})}{\partial \boldsymbol\theta} \right)^{-1}\right). \] Taking the quadratic form of the last equation gives: \[ \frac{1}{n}\hat\lambda_n' \dfrac{\partial h(\hat{\boldsymbol\theta}^0_n)}{\partial \boldsymbol\theta'} \mathcal{I}(\hat{\boldsymbol\theta}^0_n)^{-1} \frac{\partial h'(\hat{\boldsymbol\theta}^0_n;\mathbf{y})}{\partial \boldsymbol\theta} \hat\lambda_n \overset{d}{\rightarrow} \chi^2(r). \] Using Eq. (9.15), it appears that the left-hand side term of the last equation is \(\xi^{LM}\) as defined in Eq. (6.15). Consistency: see Remark 17.3 in Gouriéroux and Monfort (1995).
Proof of Proposition 6.7
Proof. Let us first demonstrate the asymptotic equivalence of \(\xi^{LM}\) and \(\xi^{LR}\).
The second-order Taylor expansions of \(\log \mathcal{L}(\hat{\boldsymbol\theta}^0_n,\mathbf{y})\) and \(\log \mathcal{L}(\hat{\boldsymbol\theta}_n,\mathbf{y})\) are: \[\begin{eqnarray*} \log \mathcal{L}(\hat{\boldsymbol\theta}_n,\mathbf{y}) &\approx& \log \mathcal{L}(\boldsymbol\theta_0,\mathbf{y}) + \frac{\partial \log \mathcal{L}(\boldsymbol\theta_0,\mathbf{y})}{\partial \boldsymbol\theta'}(\hat{\boldsymbol\theta}_n-\boldsymbol\theta_0) \\ && - \frac{n}{2} (\hat{\boldsymbol\theta}_n-\boldsymbol\theta_0)' \mathcal{I}(\boldsymbol\theta_0) (\hat{\boldsymbol\theta}_n-\boldsymbol\theta_0)\\ \log \mathcal{L}(\hat{\boldsymbol\theta}^0_n,\mathbf{y}) &\approx& \log \mathcal{L}(\boldsymbol\theta_0,\mathbf{y}) + \frac{\partial \log \mathcal{L}(\boldsymbol\theta_0,\mathbf{y})}{\partial \boldsymbol\theta'}(\hat{\boldsymbol\theta}^0_n-\boldsymbol\theta_0) \\ && - \frac{n}{2} (\hat{\boldsymbol\theta}^0_n-\boldsymbol\theta_0)' \mathcal{I}(\boldsymbol\theta_0) (\hat{\boldsymbol\theta}^0_n-\boldsymbol\theta_0). \end{eqnarray*}\] Taking the difference, we obtain: \[\begin{eqnarray*} \xi_n^{LR} &\approx& 2\frac{\partial \log \mathcal{L}(\boldsymbol\theta_0,\mathbf{y})}{\partial \boldsymbol\theta'} (\hat{\boldsymbol\theta}_n-\hat{\boldsymbol\theta}^0_n) + n (\hat{\boldsymbol\theta}^0_n-\boldsymbol\theta_0)' \mathcal{I}(\boldsymbol\theta_0) (\hat{\boldsymbol\theta}^0_n-\boldsymbol\theta_0)\\ && - n (\hat{\boldsymbol\theta}_n-\boldsymbol\theta_0)' \mathcal{I}(\boldsymbol\theta_0) (\hat{\boldsymbol\theta}_n-\boldsymbol\theta_0). \end{eqnarray*}\] Using \(\dfrac{1}{\sqrt{n}}\frac{\partial \log \mathcal{L}(\boldsymbol\theta_0;\mathbf{y})}{\partial \boldsymbol\theta} \approx \mathcal{I}(\boldsymbol\theta_0)\sqrt{n}(\hat{\boldsymbol\theta}_n-\boldsymbol\theta_0)\) (Eq. (9.12)), we have: \[\begin{eqnarray*} \xi_n^{LR} &\approx& 2n(\hat{\boldsymbol\theta}_n-\boldsymbol\theta_0)'\mathcal{I}(\boldsymbol\theta_0) (\hat{\boldsymbol\theta}_n-\hat{\boldsymbol\theta}^0_n) + n (\hat{\boldsymbol\theta}^0_n-\boldsymbol\theta_0)' \mathcal{I}(\boldsymbol\theta_0) (\hat{\boldsymbol\theta}^0_n-\boldsymbol\theta_0) \\ && - n (\hat{\boldsymbol\theta}_n-\boldsymbol\theta_0)' \mathcal{I}(\boldsymbol\theta_0) (\hat{\boldsymbol\theta}_n-\boldsymbol\theta_0). \end{eqnarray*}\] In the second of the three terms in the sum, we replace \((\hat{\boldsymbol\theta}^0_n-\boldsymbol\theta_0)\) by \((\hat{\boldsymbol\theta}^0_n-\hat{\boldsymbol\theta}_n+\hat{\boldsymbol\theta}_n-\boldsymbol\theta_0)\) and we develop the associated product. This leads to: \[\begin{equation} \xi_n^{LR} \approx n (\hat{\boldsymbol\theta}^0_n-\hat{\boldsymbol\theta}_n)' \mathcal{I}(\boldsymbol\theta_0) (\hat{\boldsymbol\theta}^0_n-\hat{\boldsymbol\theta}_n). \tag{9.17} \end{equation}\] The difference between Eqs. (9.11) and (9.12) implies: \[ \frac{1}{\sqrt{n}}\frac{\partial \log \mathcal{L}(\hat{\boldsymbol\theta}^0_n;\mathbf{y})}{\partial \boldsymbol\theta} \approx \mathcal{I}(\boldsymbol\theta_0)\sqrt{n}(\hat{\boldsymbol\theta}_n-\hat{\boldsymbol\theta}^0_n), \] which, associated to Eq. (9.17), gives: \[ \xi_n^{LR} \approx \frac{1}{n} \frac{\partial \log \mathcal{L}(\hat{\boldsymbol\theta}^0_n;\mathbf{y})}{\partial \boldsymbol\theta'} \mathcal{I}(\boldsymbol\theta_0)^{-1} \frac{\partial \log \mathcal{L}(\hat{\boldsymbol\theta}^0_n;\mathbf{y})}{\partial \boldsymbol\theta} \approx \xi_n^{LM}. \] Hence \(\xi_n^{LR}\) has the same asymptotic distribution as \(\xi_n^{LM}\).
Let’s show that the LR test is consistent. For this, note that: \[\begin{eqnarray*} \frac{\log \mathcal{L}(\hat{\boldsymbol\theta},\mathbf{y}) - \log \mathcal{L}(\hat{\boldsymbol\theta}^0,\mathbf{y})}{n} &=& \frac{1}{n} \sum_{i=1}^n[\log f(y_i;\hat{\boldsymbol\theta}_n) - \log f(y_i;\hat{\boldsymbol\theta}_n^0)]\\ &\rightarrow& \mathbb{E}_0[\log f(Y;\boldsymbol\theta_0) - \log f(Y;\boldsymbol\theta_\infty)], \end{eqnarray*}\] where \(\boldsymbol\theta_\infty\), the pseudo true value, is such that \(h(\boldsymbol\theta_\infty) \ne 0\) (by definition of \(H_1\)). From the Kullback inequality and the asymptotic identifiability of \(\boldsymbol\theta_0\), it follows that \(\mathbb{E}_0[\log f(Y;\boldsymbol\theta_0) - \log f(Y;\boldsymbol\theta_\infty)] >0\). Therefore \(\xi_n^{LR} \rightarrow + \infty\) under \(H_1\).
Let us now demonstrate the equivalence of \(\xi^{LM} and \xi^{W}\).
We have (using Eq. (9.15)): \[ \xi^{LM}_n = \frac{1}{n}\hat\lambda_n' \dfrac{\partial h(\hat{\boldsymbol\theta}^0_n)}{\partial \boldsymbol\theta'} \mathcal{I}(\hat{\boldsymbol\theta}^0_n)^{-1} \frac{\partial h'(\hat{\boldsymbol\theta}^0_n;\mathbf{y})}{\partial \boldsymbol\theta} \hat\lambda_n. \] Since, under \(H_0\), \(\hat{\boldsymbol\theta}_n^0\approx\hat{\boldsymbol\theta}_n \approx {\boldsymbol\theta}_0\), Eq. (9.16) therefore implies that: \[ \xi^{LM} \approx n h(\hat{\boldsymbol\theta}_n)' \left( \dfrac{\partial h(\hat{\boldsymbol\theta}_n)}{\partial \boldsymbol\theta'} \mathcal{I}(\hat{\boldsymbol\theta}_n)^{-1} \frac{\partial h'(\hat{\boldsymbol\theta}_n;\mathbf{y})}{\partial \boldsymbol\theta} \right)^{-1} h(\hat{\boldsymbol\theta}_n) = \xi^{W}, \] which gives the result.
Proof of Eq. (8.3)
Proof. We have: \[\begin{eqnarray*} &&T\mathbb{E}\left[(\bar{y}_T - \mu)^2\right]\\ &=& T\mathbb{E}\left[\left(\frac{1}{T}\sum_{t=1}^T(y_t - \mu)\right)^2\right] = \frac{1}{T} \mathbb{E}\left[\sum_{t=1}^T(y_t - \mu)^2+2\sum_{s<t\le T}(y_t - \mu)(y_s - \mu)\right]\\ &=& \gamma_0 +\frac{2}{T}\left(\sum_{t=2}^{T}\mathbb{E}\left[(y_t - \mu)(y_{t-1} - \mu)\right]\right) +\frac{2}{T}\left(\sum_{t=3}^{T}\mathbb{E}\left[(y_t - \mu)(y_{t-2} - \mu)\right]\right) + \dots \\ &&+ \frac{2}{T}\left(\sum_{t=T-1}^{T}\mathbb{E}\left[(y_t - \mu)(y_{t-(T-2)} - \mu)\right]\right) + \frac{2}{T}\mathbb{E}\left[(y_t - \mu)(y_{t-(T-1)} - \mu)\right]\\ &=& \gamma_0 + 2 \frac{T-1}{T}\gamma_1 + \dots + 2 \frac{1}{T}\gamma_{T-1} . \end{eqnarray*}\] Therefore: \[\begin{eqnarray*} && T\mathbb{E}\left[(\bar{y}_T - \mu)^2\right] - \sum_{j=-\infty}^{+\infty} \gamma_j \\ &=& - 2\frac{1}{T}\gamma_1 - 2\frac{2}{T}\gamma_2 - \dots - 2\frac{T-1}{T}\gamma_{T-1} - 2\gamma_T - 2 \gamma_{T+1} + \dots \end{eqnarray*}\] And then: \[\begin{eqnarray*} && \left|T\mathbb{E}\left[(\bar{y}_T - \mu)^2\right] - \sum_{j=-\infty}^{+\infty} \gamma_j\right|\\ &\le& 2\frac{1}{T}|\gamma_1| + 2\frac{2}{T}|\gamma_2| + \dots + 2\frac{T-1}{T}|\gamma_{T-1}| + 2|\gamma_T| + 2 |\gamma_{T+1}| + \dots \end{eqnarray*}\]
For any \(q \le T\), we have: \[\begin{eqnarray*} \left|T\mathbb{E}\left[(\bar{y}_T - \mu)^2\right] - \sum_{j=-\infty}^{+\infty} \gamma_j\right| &\le& 2\frac{1}{T}|\gamma_1| + 2\frac{2}{T}|\gamma_2| + \dots + 2\frac{q-1}{T}|\gamma_{q-1}| +2\frac{q}{T}|\gamma_q| +\\ &&2\frac{q+1}{T}|\gamma_{q+1}| + \dots + 2\frac{T-1}{T}|\gamma_{T-1}| + 2|\gamma_T| + 2 |\gamma_{T+1}| + \dots\\ &\le& \frac{2}{T}\left(|\gamma_1| + 2|\gamma_2| + \dots + (q-1)|\gamma_{q-1}| +q|\gamma_q|\right) +\\ &&2|\gamma_{q+1}| + \dots + 2|\gamma_{T-1}| + 2|\gamma_T| + 2 |\gamma_{T+1}| + \dots \end{eqnarray*}\]
Consider \(\varepsilon > 0\). The fact that the autocovariances are absolutely summable implies that there exists \(q_0\) such that (Cauchy criterion, Theorem 9.2): \[ 2|\gamma_{q_0+1}|+2|\gamma_{q_0+2}|+2|\gamma_{q_0+3}|+\dots < \varepsilon/2. \] Then, if \(T > q_0\), it comes that: \[ \left|T \mathbb{E}\left[(\bar{y}_T - \mu)^2\right] - \sum_{j=-\infty}^{+\infty} \gamma_j\right|\le \frac{2}{T}\left(|\gamma_1| + 2|\gamma_2| + \dots + (q_0-1)|\gamma_{q_0-1}| +q_0|\gamma_{q_0}|\right) + \varepsilon/2. \] If \(T \ge 2\left(|\gamma_1| + 2|\gamma_2| + \dots + (q_0-1)|\gamma_{q_0-1}| +q_0|\gamma_{q_0}|\right)/(\varepsilon/2)\) (\(= f(q_0)\), say) then \[ \frac{2}{T}\left(|\gamma_1| + 2|\gamma_2| + \dots + (q_0-1)|\gamma_{q_0-1}| +q_0|\gamma_{q_0}|\right) \le \varepsilon/2. \] Then, if \(T>f(q_0)\) and \(T>q_0\), i.e. if \(T>\max(f(q_0),q_0)\), we have: \[ \left|T \mathbb{E}\left[(\bar{y}_T - \mu)^2\right] - \sum_{j=-\infty}^{+\infty} \gamma_j\right|\le \varepsilon. \]
Proof of Proposition 8.7
Proof. We have: \[\begin{eqnarray} \mathbb{E}([y_{t+1} - y^*_{t+1}]^2) &=& \mathbb{E}\left([\color{blue}{\{y_{t+1} - \mathbb{E}(y_{t+1}|x_t)\}} + \color{red}{\{\mathbb{E}(y_{t+1}|x_t) - y^*_{t+1}\}}]^2\right)\nonumber\\ &=& \mathbb{E}\left(\color{blue}{[y_{t+1} - \mathbb{E}(y_{t+1}|x_t)]}^2\right) + \mathbb{E}\left(\color{red}{[\mathbb{E}(y_{t+1}|x_t) - y^*_{t+1}]}^2\right)\nonumber\\ && + 2\mathbb{E}\left( \color{blue}{[y_{t+1} - \mathbb{E}(y_{t+1}|x_t)]}\color{red}{ [\mathbb{E}(y_{t+1}|x_t) - y^*_{t+1}]}\right). \tag{9.18} \end{eqnarray}\] Let us focus on the last term. We have: \[\begin{eqnarray*} &&\mathbb{E}\left(\color{blue}{[y_{t+1} - \mathbb{E}(y_{t+1}|x_t)]}\color{red}{ [\mathbb{E}(y_{t+1}|x_t) - y^*_{t+1}]}\right)\\ &=& \mathbb{E}( \mathbb{E}( \color{blue}{[y_{t+1} - \mathbb{E}(y_{t+1}|x_t)]}\color{red}{ \underbrace{[\mathbb{E}(y_{t+1}|x_t) - y^*_{t+1}]}_{\mbox{function of $x_t$}}}|x_t))\\ &=& \mathbb{E}( \color{red}{ [\mathbb{E}(y_{t+1}|x_t) - y^*_{t+1}]} \mathbb{E}( \color{blue}{[y_{t+1} - \mathbb{E}(y_{t+1}|x_t)]}|x_t))\\ &=& \mathbb{E}( \color{red}{ [\mathbb{E}(y_{t+1}|x_t) - y^*_{t+1}]} \color{blue}{\underbrace{[\mathbb{E}(y_{t+1}|x_t) - \mathbb{E}(y_{t+1}|x_t)]}_{=0}})=0. \end{eqnarray*}\]
Therefore, Eq. (9.18) becomes: \[\begin{eqnarray*} &&\mathbb{E}([y_{t+1} - y^*_{t+1}]^2) \\ &=& \underbrace{\mathbb{E}\left(\color{blue}{[y_{t+1} - \mathbb{E}(y_{t+1}|x_t)]}^2\right)}_{\mbox{$\ge 0$ and does not depend on $y^*_{t+1}$}} + \underbrace{\mathbb{E}\left(\color{red}{[\mathbb{E}(y_{t+1}|x_t) - y^*_{t+1}]}^2\right)}_{\mbox{$\ge 0$ and depends on $y^*_{t+1}$}}. \end{eqnarray*}\] This implies that \(\mathbb{E}([y_{t+1} - y^*_{t+1}]^2)\) is always larger than \(\color{blue}{\mathbb{E}([y_{t+1} - \mathbb{E}(y_{t+1}|x_t)]^2)}\), and is therefore minimized if the second term is equal to zero, that is if \(\mathbb{E}(y_{t+1}|x_t) = y^*_{t+1}\).
Gaussian multivariate regression: likelihood derivation
For \(y_t=\Pi'x_t+\varepsilon_t\) with independent Gaussian errors of positive definite covariance \(\Omega\) and a full-rank regressor matrix, the conditional maximum-likelihood estimator of \(\Pi\) equals equation-by-equation OLS. The covariance estimator is the residual cross-product matrix divided by the number of observations. The derivation follows.
Proof. Using Proposition 9.18, we obtain that, conditionally on \(x_1\), the log-likelihood is given by \[\begin{eqnarray*} \log\mathcal{L}(Y_{T};\theta) & = & -(Tn/2)\log(2\pi)+(T/2)\log\left|\Omega^{-1}\right|\\ & & -\frac{1}{2}\sum_{t=1}^{T}\left[\left(y_{t}-\Pi'x_{t}\right)'\Omega^{-1}\left(y_{t}-\Pi'x_{t}\right)\right]. \end{eqnarray*}\] Let’s rewrite the last term of the log-likelihood: \[\begin{eqnarray*} \sum_{t=1}^{T}\left[\left(y_{t}-\Pi'x_{t}\right)'\Omega^{-1}\left(y_{t}-\Pi'x_{t}\right)\right] & =\\ \sum_{t=1}^{T}\left[\left(y_{t}-\hat{\Pi}'x_{t}+\hat{\Pi}'x_{t}-\Pi'x_{t}\right)'\Omega^{-1}\left(y_{t}-\hat{\Pi}'x_{t}+\hat{\Pi}'x_{t}-\Pi'x_{t}\right)\right] & =\\ \sum_{t=1}^{T}\left[\left(\hat{\varepsilon}_{t}+(\hat{\Pi}-\Pi)'x_{t}\right)'\Omega^{-1}\left(\hat{\varepsilon}_{t}+(\hat{\Pi}-\Pi)'x_{t}\right)\right], \end{eqnarray*}\] where the \(j^{th}\) element of the \((n\times1)\) vector \(\hat{\varepsilon}_{t}\) is the sample residual, for observation \(t\), from an OLS regression of \(y_{j,t}\) on \(x_{t}\). Expanding the previous equation, we get: \[\begin{eqnarray*} &&\sum_{t=1}^{T}\left[\left(y_{t}-\Pi'x_{t}\right)'\Omega^{-1}\left(y_{t}-\Pi'x_{t}\right)\right] = \sum_{t=1}^{T}\hat{\varepsilon}_{t}'\Omega^{-1}\hat{\varepsilon}_{t}\\ &&+2\sum_{t=1}^{T}\hat{\varepsilon}_{t}'\Omega^{-1}(\hat{\Pi}-\Pi)'x_{t}+\sum_{t=1}^{T}x'_{t}(\hat{\Pi}-\Pi)\Omega^{-1}(\hat{\Pi}-\Pi)'x_{t}. \end{eqnarray*}\] Let’s apply the trace operator on the second term (that is a scalar): \[\begin{eqnarray*} \sum_{t=1}^{T}\hat{\varepsilon}_{t}'\Omega^{-1}(\hat{\Pi}-\Pi)'x_{t} & = & Tr\left(\sum_{t=1}^{T}\hat{\varepsilon}_{t}'\Omega^{-1}(\hat{\Pi}-\Pi)'x_{t}\right)\\ = Tr\left(\sum_{t=1}^{T}\Omega^{-1}(\hat{\Pi}-\Pi)'x_{t}\hat{\varepsilon}_{t}'\right) & = & Tr\left(\Omega^{-1}(\hat{\Pi}-\Pi)'\sum_{t=1}^{T}x_{t}\hat{\varepsilon}_{t}'\right). \end{eqnarray*}\] Given that, by construction (property of OLS estimates), the sample residuals are orthogonal to the explanatory variables, this term is zero. Introducing \(\tilde{x}_{t}=(\hat{\Pi}-\Pi)'x_{t}\), we have \[\begin{eqnarray*} \sum_{t=1}^{T}\left[\left(y_{t}-\Pi'x_{t}\right)'\Omega^{-1}\left(y_{t}-\Pi'x_{t}\right)\right] =\sum_{t=1}^{T}\hat{\varepsilon}_{t}'\Omega^{-1}\hat{\varepsilon}_{t}+\sum_{t=1}^{T}\tilde{x}'_{t}\Omega^{-1}\tilde{x}_{t}. \end{eqnarray*}\] Since \(\Omega\) is a positive definite matrix, \(\Omega^{-1}\) is as well. Consequently, the smallest value that the last term can take is obtained for \(\tilde{x}_{t}=0\), i.e. when \(\Pi=\hat{\Pi}.\)
The MLE of \(\Omega\) is the matrix \(\hat{\Omega}\) that maximizes \(\Omega\overset{\ell}{\rightarrow}L(Y_{T};\hat{\Pi},\Omega)\). We have: \[\begin{eqnarray*} \log\mathcal{L}(Y_{T};\hat{\Pi},\Omega) & = & -(Tn/2)\log(2\pi)+(T/2)\log\left|\Omega^{-1}\right| -\frac{1}{2}\sum_{t=1}^{T}\left[\hat{\varepsilon}_{t}'\Omega^{-1}\hat{\varepsilon}_{t}\right]. \end{eqnarray*}\]
Let \(A=\Omega^{-1}\). Differentiating the log-likelihood with respect to the symmetric precision matrix \(A\) gives \[ \frac{\partial \log\mathcal{L}(Y_{T};\hat{\Pi},A)}{\partial A}=\frac{T}{2}A^{-1}-\frac{1}{2}\sum_{t=1}^{T}\hat{\varepsilon}_{t}\hat{\varepsilon}'_{t}=0. \] Therefore \[ \hat{\Omega}=\frac{1}{T}\sum_{t=1}^{T}\hat{\varepsilon}_{t}\hat{\varepsilon}'_{t}, \] which leads to the result.
9.6 Statistical tables
| a | 0.00 | 0.01 | 0.02 | 0.03 | 0.04 | 0.05 | 0.06 | 0.07 | 0.08 | 0.09 |
|---|---|---|---|---|---|---|---|---|---|---|
| 0.0 | 0.5000 | 0.5040 | 0.5080 | 0.5120 | 0.5160 | 0.5199 | 0.5239 | 0.5279 | 0.5319 | 0.5359 |
| 0.1 | 0.5398 | 0.5438 | 0.5478 | 0.5517 | 0.5557 | 0.5596 | 0.5636 | 0.5675 | 0.5714 | 0.5753 |
| 0.2 | 0.5793 | 0.5832 | 0.5871 | 0.5910 | 0.5948 | 0.5987 | 0.6026 | 0.6064 | 0.6103 | 0.6141 |
| 0.3 | 0.6179 | 0.6217 | 0.6255 | 0.6293 | 0.6331 | 0.6368 | 0.6406 | 0.6443 | 0.6480 | 0.6517 |
| 0.4 | 0.6554 | 0.6591 | 0.6628 | 0.6664 | 0.6700 | 0.6736 | 0.6772 | 0.6808 | 0.6844 | 0.6879 |
| 0.5 | 0.6915 | 0.6950 | 0.6985 | 0.7019 | 0.7054 | 0.7088 | 0.7123 | 0.7157 | 0.7190 | 0.7224 |
| 0.6 | 0.7257 | 0.7291 | 0.7324 | 0.7357 | 0.7389 | 0.7422 | 0.7454 | 0.7486 | 0.7517 | 0.7549 |
| 0.7 | 0.7580 | 0.7611 | 0.7642 | 0.7673 | 0.7704 | 0.7734 | 0.7764 | 0.7794 | 0.7823 | 0.7852 |
| 0.8 | 0.7881 | 0.7910 | 0.7939 | 0.7967 | 0.7995 | 0.8023 | 0.8051 | 0.8078 | 0.8106 | 0.8133 |
| 0.9 | 0.8159 | 0.8186 | 0.8212 | 0.8238 | 0.8264 | 0.8289 | 0.8315 | 0.8340 | 0.8365 | 0.8389 |
| 1.0 | 0.8413 | 0.8438 | 0.8461 | 0.8485 | 0.8508 | 0.8531 | 0.8554 | 0.8577 | 0.8599 | 0.8621 |
| 1.1 | 0.8643 | 0.8665 | 0.8686 | 0.8708 | 0.8729 | 0.8749 | 0.8770 | 0.8790 | 0.8810 | 0.8830 |
| 1.2 | 0.8849 | 0.8869 | 0.8888 | 0.8907 | 0.8925 | 0.8944 | 0.8962 | 0.8980 | 0.8997 | 0.9015 |
| 1.3 | 0.9032 | 0.9049 | 0.9066 | 0.9082 | 0.9099 | 0.9115 | 0.9131 | 0.9147 | 0.9162 | 0.9177 |
| 1.4 | 0.9192 | 0.9207 | 0.9222 | 0.9236 | 0.9251 | 0.9265 | 0.9279 | 0.9292 | 0.9306 | 0.9319 |
| 1.5 | 0.9332 | 0.9345 | 0.9357 | 0.9370 | 0.9382 | 0.9394 | 0.9406 | 0.9418 | 0.9429 | 0.9441 |
| 1.6 | 0.9452 | 0.9463 | 0.9474 | 0.9484 | 0.9495 | 0.9505 | 0.9515 | 0.9525 | 0.9535 | 0.9545 |
| 1.7 | 0.9554 | 0.9564 | 0.9573 | 0.9582 | 0.9591 | 0.9599 | 0.9608 | 0.9616 | 0.9625 | 0.9633 |
| 1.8 | 0.9641 | 0.9649 | 0.9656 | 0.9664 | 0.9671 | 0.9678 | 0.9686 | 0.9693 | 0.9699 | 0.9706 |
| 1.9 | 0.9713 | 0.9719 | 0.9726 | 0.9732 | 0.9738 | 0.9744 | 0.9750 | 0.9756 | 0.9761 | 0.9767 |
| 2.0 | 0.9772 | 0.9778 | 0.9783 | 0.9788 | 0.9793 | 0.9798 | 0.9803 | 0.9808 | 0.9812 | 0.9817 |
| 2.1 | 0.9821 | 0.9826 | 0.9830 | 0.9834 | 0.9838 | 0.9842 | 0.9846 | 0.9850 | 0.9854 | 0.9857 |
| 2.2 | 0.9861 | 0.9864 | 0.9868 | 0.9871 | 0.9875 | 0.9878 | 0.9881 | 0.9884 | 0.9887 | 0.9890 |
| 2.3 | 0.9893 | 0.9896 | 0.9898 | 0.9901 | 0.9904 | 0.9906 | 0.9909 | 0.9911 | 0.9913 | 0.9916 |
| 2.4 | 0.9918 | 0.9920 | 0.9922 | 0.9925 | 0.9927 | 0.9929 | 0.9931 | 0.9932 | 0.9934 | 0.9936 |
| 2.5 | 0.9938 | 0.9940 | 0.9941 | 0.9943 | 0.9945 | 0.9946 | 0.9948 | 0.9949 | 0.9951 | 0.9952 |
| 2.6 | 0.9953 | 0.9955 | 0.9956 | 0.9957 | 0.9959 | 0.9960 | 0.9961 | 0.9962 | 0.9963 | 0.9964 |
| 2.7 | 0.9965 | 0.9966 | 0.9967 | 0.9968 | 0.9969 | 0.9970 | 0.9971 | 0.9972 | 0.9973 | 0.9974 |
| 2.8 | 0.9974 | 0.9975 | 0.9976 | 0.9977 | 0.9977 | 0.9978 | 0.9979 | 0.9979 | 0.9980 | 0.9981 |
| 2.9 | 0.9981 | 0.9982 | 0.9982 | 0.9983 | 0.9984 | 0.9984 | 0.9985 | 0.9985 | 0.9986 | 0.9986 |
| 3.0 | 0.9987 | 0.9987 | 0.9987 | 0.9988 | 0.9988 | 0.9989 | 0.9989 | 0.9989 | 0.9990 | 0.9990 |
| df | 0.05 | 0.1 | 0.75 | 0.9 | 0.95 | 0.975 | 0.99 | 0.999 |
|---|---|---|---|---|---|---|---|---|
| 1 | 0.079 | 0.158 | 2.414 | 6.314 | 12.706 | 25.452 | 63.657 | 636.619 |
| 2 | 0.071 | 0.142 | 1.604 | 2.920 | 4.303 | 6.205 | 9.925 | 31.599 |
| 3 | 0.068 | 0.137 | 1.423 | 2.353 | 3.182 | 4.177 | 5.841 | 12.924 |
| 4 | 0.067 | 0.134 | 1.344 | 2.132 | 2.776 | 3.495 | 4.604 | 8.610 |
| 5 | 0.066 | 0.132 | 1.301 | 2.015 | 2.571 | 3.163 | 4.032 | 6.869 |
| 6 | 0.065 | 0.131 | 1.273 | 1.943 | 2.447 | 2.969 | 3.707 | 5.959 |
| 7 | 0.065 | 0.130 | 1.254 | 1.895 | 2.365 | 2.841 | 3.499 | 5.408 |
| 8 | 0.065 | 0.130 | 1.240 | 1.860 | 2.306 | 2.752 | 3.355 | 5.041 |
| 9 | 0.064 | 0.129 | 1.230 | 1.833 | 2.262 | 2.685 | 3.250 | 4.781 |
| 10 | 0.064 | 0.129 | 1.221 | 1.812 | 2.228 | 2.634 | 3.169 | 4.587 |
| 20 | 0.063 | 0.127 | 1.185 | 1.725 | 2.086 | 2.423 | 2.845 | 3.850 |
| 30 | 0.063 | 0.127 | 1.173 | 1.697 | 2.042 | 2.360 | 2.750 | 3.646 |
| 40 | 0.063 | 0.126 | 1.167 | 1.684 | 2.021 | 2.329 | 2.704 | 3.551 |
| 50 | 0.063 | 0.126 | 1.164 | 1.676 | 2.009 | 2.311 | 2.678 | 3.496 |
| 60 | 0.063 | 0.126 | 1.162 | 1.671 | 2.000 | 2.299 | 2.660 | 3.460 |
| 70 | 0.063 | 0.126 | 1.160 | 1.667 | 1.994 | 2.291 | 2.648 | 3.435 |
| 80 | 0.063 | 0.126 | 1.159 | 1.664 | 1.990 | 2.284 | 2.639 | 3.416 |
| 90 | 0.063 | 0.126 | 1.158 | 1.662 | 1.987 | 2.280 | 2.632 | 3.402 |
| 100 | 0.063 | 0.126 | 1.157 | 1.660 | 1.984 | 2.276 | 2.626 | 3.390 |
| 200 | 0.063 | 0.126 | 1.154 | 1.653 | 1.972 | 2.258 | 2.601 | 3.340 |
| 500 | 0.063 | 0.126 | 1.152 | 1.648 | 1.965 | 2.248 | 2.586 | 3.310 |
| df | 0.05 | 0.1 | 0.75 | 0.9 | 0.95 | 0.975 | 0.99 | 0.999 |
|---|---|---|---|---|---|---|---|---|
| 1 | 0.004 | 0.016 | 1.323 | 2.706 | 3.841 | 5.024 | 6.635 | 10.828 |
| 2 | 0.103 | 0.211 | 2.773 | 4.605 | 5.991 | 7.378 | 9.210 | 13.816 |
| 3 | 0.352 | 0.584 | 4.108 | 6.251 | 7.815 | 9.348 | 11.345 | 16.266 |
| 4 | 0.711 | 1.064 | 5.385 | 7.779 | 9.488 | 11.143 | 13.277 | 18.467 |
| 5 | 1.145 | 1.610 | 6.626 | 9.236 | 11.070 | 12.833 | 15.086 | 20.515 |
| 6 | 1.635 | 2.204 | 7.841 | 10.645 | 12.592 | 14.449 | 16.812 | 22.458 |
| 7 | 2.167 | 2.833 | 9.037 | 12.017 | 14.067 | 16.013 | 18.475 | 24.322 |
| 8 | 2.733 | 3.490 | 10.219 | 13.362 | 15.507 | 17.535 | 20.090 | 26.124 |
| 9 | 3.325 | 4.168 | 11.389 | 14.684 | 16.919 | 19.023 | 21.666 | 27.877 |
| 10 | 3.940 | 4.865 | 12.549 | 15.987 | 18.307 | 20.483 | 23.209 | 29.588 |
| 20 | 10.851 | 12.443 | 23.828 | 28.412 | 31.410 | 34.170 | 37.566 | 45.315 |
| 30 | 18.493 | 20.599 | 34.800 | 40.256 | 43.773 | 46.979 | 50.892 | 59.703 |
| 40 | 26.509 | 29.051 | 45.616 | 51.805 | 55.758 | 59.342 | 63.691 | 73.402 |
| 50 | 34.764 | 37.689 | 56.334 | 63.167 | 67.505 | 71.420 | 76.154 | 86.661 |
| 60 | 43.188 | 46.459 | 66.981 | 74.397 | 79.082 | 83.298 | 88.379 | 99.607 |
| 70 | 51.739 | 55.329 | 77.577 | 85.527 | 90.531 | 95.023 | 100.425 | 112.317 |
| 80 | 60.391 | 64.278 | 88.130 | 96.578 | 101.879 | 106.629 | 112.329 | 124.839 |
| 90 | 69.126 | 73.291 | 98.650 | 107.565 | 113.145 | 118.136 | 124.116 | 137.208 |
| 100 | 77.929 | 82.358 | 109.141 | 118.498 | 124.342 | 129.561 | 135.807 | 149.449 |
| 200 | 168.279 | 174.835 | 213.102 | 226.021 | 233.994 | 241.058 | 249.445 | 267.541 |
| 500 | 449.147 | 459.926 | 520.950 | 540.930 | 553.127 | 563.852 | 576.493 | 603.446 |
| df2 | 1 | 2 | 3 | 4 | 5 | 6 | 7 | 8 | 9 | 10 |
|---|---|---|---|---|---|---|---|---|---|---|
| alpha = 0.9 | ||||||||||
| 5 | 4.060 | 3.780 | 3.619 | 3.520 | 3.453 | 3.405 | 3.368 | 3.339 | 3.316 | 3.297 |
| 10 | 3.285 | 2.924 | 2.728 | 2.605 | 2.522 | 2.461 | 2.414 | 2.377 | 2.347 | 2.323 |
| 15 | 3.073 | 2.695 | 2.490 | 2.361 | 2.273 | 2.208 | 2.158 | 2.119 | 2.086 | 2.059 |
| 20 | 2.975 | 2.589 | 2.380 | 2.249 | 2.158 | 2.091 | 2.040 | 1.999 | 1.965 | 1.937 |
| 50 | 2.809 | 2.412 | 2.197 | 2.061 | 1.966 | 1.895 | 1.840 | 1.796 | 1.760 | 1.729 |
| 100 | 2.756 | 2.356 | 2.139 | 2.002 | 1.906 | 1.834 | 1.778 | 1.732 | 1.695 | 1.663 |
| 500 | 2.716 | 2.313 | 2.095 | 1.956 | 1.859 | 1.786 | 1.729 | 1.683 | 1.644 | 1.612 |
| alpha = 0.95 | ||||||||||
| 5 | 6.608 | 5.786 | 5.409 | 5.192 | 5.050 | 4.950 | 4.876 | 4.818 | 4.772 | 4.735 |
| 10 | 4.965 | 4.103 | 3.708 | 3.478 | 3.326 | 3.217 | 3.135 | 3.072 | 3.020 | 2.978 |
| 15 | 4.543 | 3.682 | 3.287 | 3.056 | 2.901 | 2.790 | 2.707 | 2.641 | 2.588 | 2.544 |
| 20 | 4.351 | 3.493 | 3.098 | 2.866 | 2.711 | 2.599 | 2.514 | 2.447 | 2.393 | 2.348 |
| 50 | 4.034 | 3.183 | 2.790 | 2.557 | 2.400 | 2.286 | 2.199 | 2.130 | 2.073 | 2.026 |
| 100 | 3.936 | 3.087 | 2.696 | 2.463 | 2.305 | 2.191 | 2.103 | 2.032 | 1.975 | 1.927 |
| 500 | 3.860 | 3.014 | 2.623 | 2.390 | 2.232 | 2.117 | 2.028 | 1.957 | 1.899 | 1.850 |
| alpha = 0.99 | ||||||||||
| 5 | 16.258 | 13.274 | 12.060 | 11.392 | 10.967 | 10.672 | 10.456 | 10.289 | 10.158 | 10.051 |
| 10 | 10.044 | 7.559 | 6.552 | 5.994 | 5.636 | 5.386 | 5.200 | 5.057 | 4.942 | 4.849 |
| 15 | 8.683 | 6.359 | 5.417 | 4.893 | 4.556 | 4.318 | 4.142 | 4.004 | 3.895 | 3.805 |
| 20 | 8.096 | 5.849 | 4.938 | 4.431 | 4.103 | 3.871 | 3.699 | 3.564 | 3.457 | 3.368 |
| 50 | 7.171 | 5.057 | 4.199 | 3.720 | 3.408 | 3.186 | 3.020 | 2.890 | 2.785 | 2.698 |
| 100 | 6.895 | 4.824 | 3.984 | 3.513 | 3.206 | 2.988 | 2.823 | 2.694 | 2.590 | 2.503 |
| 500 | 6.686 | 4.648 | 3.821 | 3.357 | 3.054 | 2.838 | 2.675 | 2.547 | 2.443 | 2.356 |